|
|
|
| |
| ABSTRACT |
|
Measurement of lower limb strength, power and asymmetries of soccer players is important for monitoring physical development and injury risk. The aim of the present study was to establish the reliability and limits of meaningful change of single and double leg maximal strength, power and bilateral imbalance measures in elite soccer players using a pneumatic resistance based seated leg press. Thirteen participants undertook an incremental resistance leg press test on three separate testing days within a seven day period. Paired t-tests established no significant differences (p > 0.156) between consecutive tests, whilst ‘good’ reliability (intraclass correlation coefficient-ICC >0.762) and acceptable typical percentage errors (< 6.9%) were observed for maximal resistance, velocity and force pushed as well as average and peak power outputs. Imbalance variables accounting for left and right leg average power output across all repetitions were established as the most reliable imbalance variables, with ‘good’ reliability (ICC > 0.874) and absolute typical error values of 2.1%. Imbalance variables calculated using peak power output or average power output from the last 4 repetitions resulted in weaker reliability (ICC < 0.657) and significant differences between tests, and therefore were considered less suitable for applied use. Subsequently, to better inform the practitioner, limits of meaningful change were calculated for all strength, power and imbalance variables. The current study shows that lower limb strength, and power output variables and average imbalance measures of soccer players assessed through a seated leg press protocol show acceptable levels of reliability, and provides practitioners with limits of meaningful change around parameters to better evaluate test results. |
| Key words:
Football, imbalance, performance, testing
|
Key
Points
- Paired tests found no significant differences between consecutive tests and ‘very strong’ reliability for all strength and power variables.
- Imbalance variables accounting for the average power output across all repetitions for left and right legs were found as the most reliable with ‘very strong’ reliability.
- Despite establishing ‘strong’ reliability, imbalance variables accounting for peak power output and average power output from the last 4 repetitions had the poorer reliability, limiting their application as a reliable marker of imbalance.
- Limits of meaningful change established for each strength, power and imbalance variable provide practitioners with parameters to better evaluate test results.
|
Leg strength and power are important physical attributes for soccer, for competent skill execution (Cabri et al., 1988; Cometti et al., 2001) and injury prevention (Henderson et al., 2010, van Beijsterveldt et al., 2013). In particular, left-right leg strength/power asymmetries are commonly associated with increased injury risk in soccer (Croisier et al., 2002; Knapik et al., 1991). Measurements of leg strength, power and asymmetry can be an important tool to assess an athlete’s physical ability, and to monitor changes that occur with training or detraining. For practitioners to have confidence in any test, results attained from it must be considered reliable and have established ranges of meaningful change (expected natural variation around a test, needed to establish if longitudinal change can be considered ‘real’). The reliability of leg strength and power assessment protocols has been reported extensively. Various studies investigating reliability of double leg jumps including un-resisted and resisted countermovement jumps (Nuzzo et al., 2011,Young et al., 1997), squat jumps (Ortega et al., 2008) and broad jumps (Ortega et al., 2008, Wiklander and Lysholm, 1987) have reported test-retest coefficients of variations (CV) between 1.8%-6.0% and intraclass correlation coefficient (ICC) values between 0.88-0.93, with all studies suggesting that double leg jump tests show ‘good’ or ‘excellent’ test-retest reliability. As the majority of movements in sport (e.g. running, cutting and kicking) involve single leg loading (Fousekis et al., 2010, Reilly 1996), to improve specificity of testing, single leg jump testing has also been utilised across the literature as a lower limb strength and power assessment protocol. As such, various single leg hop tests such as horizontal distance (Bandy et al., 1994; Paterno and Greenberger, 1996), vertical hop and triple hop for distance (Munro and Herrington, 2011) have also been assessed for reliability. These studies consistently show ‘good’ reliability, with ICC values between 0.76-0.96 and no significant differences between any repeated tests. Test-retest reliability of left-right leg asymmetries obtained through single leg hops has been reported to be ‘good’ (ICC > 0.81) in some studies (Hopper et al., 2002; Reid et al., 2007), although Risberg et al (1995) found that a 21% change in performance was needed to establish significance due the variation they found between repeated tests (7.7% coefficient of variation-CV). Differences in findings may be due to large learning effects associated with single leg jumps (Bogla and Keskula, 1997; Booher et al., 1993) suggesting that extensive familiarisation to the movement technique may be required particularly for adolescent athletes. Additionally, due to the necessity to bear load through hip, knee and ankle joints, the use of double and single leg jumps as a measure of lower limb power can be limited with load compromised individuals and alternative offloaded protocols with greater control of movement are useful for testing in the elite environment. Isokinetic dynamometry is also commonly used to assess lower limb strength and power and has consistently been found to elicit ‘moderate’ to ‘excellent’ test-retest reliability with ICC values between 0.71-0.99 tested over a range of velocities and muscle actions (Abernethy et al., 1995; Gleeson and Mercer, 1992; Li et al., 1996; Pincivero et al., 1997). However, studies assessing the reliability of left-right leg strength/power asymmetries obtained through isokinetic dynamometry have found weaker reliability with ICC values ranging between 0.29-0.78 and standard error of mean (SEM) between 3.2% to 8.7% (Impellizzeri et al., 2007, Impellizzeri et al., 2008). Isokinetic dynamometry also lacks applicability to sporting movement (Cometti et al., 2001) and has low correlation with other sports performance measures (Mognoni et al., 1994). Therefore, isokinetic dynamometry may not be an applicable lower limb assessment tool for soccer players. The Keiser Air 420 seated leg press (Keiser Corporation, Fresno, CA) is a pneumatic resistance-based seated leg press machine with the left and right footplates that move independently of each other. Movement from a seated position with feet elevated enables offloaded maximal strength and power testing utilising movements that may be considered more applicable to the sporting environment than isokinetic dynamometry, overcoming many of the aforementioned issues. However, to date, there has only been one study investigating the reliability of the Keiser Air 420 (LeBrasseur et al., 2008) which found a non-statistically significant increase in maximum resistance of 1.1% and ‘excellent’ test-rest reliability (ICC:0.990) between 2 trials. However, reliability was not established for single or double leg power values or for left-right leg asymmetries, and as participants were classified as healthy males (age range: 37-70 y), the findings cannot be generalizable to an elite soccer population. Therefore, the current study aimed to establish the reliability of double leg maximal strength, single leg and double leg power and left-right power asymmetries in elite soccer players using a seated leg press. Additionally, the study aimed to quantify the magnitude of change between tests that can be confidently established as outside of the range of natural variability of the test. Experimental approach to the problemThe current study used a repeated test-retest protocol in which participants undertook an incremental resistance leg press test on three separate occasions to assess for variation between tests. Each test was completed at least 72 hours following and within 192 hours of the individuals’ previous test (mean interval of 132±43 hours). Tests took place prior to a training session, occurred at the same time of day, following a day consisting of minimal or no physical stimulus (<4000 m total distance, <50 m high intensity distance and <5 minutes above 85% max heart rate) established through GPS monitoring (Statsports Viper, Statsports Technologies Ltd, N.Ireland) and greater than 60 hours following a competitive match or lower limb strengthening session. The testing period was specifically selected as a period in the season when on-field conditioning was at its most consistent day-to-day and week-to-week.
SubjectsThirteen elite male professional soccer players (Age: 18.4 ± 0.8 y, height: 1.79 ± 0.09 m, weight: 72.1 ± 6.7 kg, body fat: 9.6 ± 1.4%, VO2 max: 58.1 ± 1.3 ml·kg-1·min-1) volunteered for this study. A small sample size was considered acceptable due to the elite level of participants and is in line with previous research conducted within the research field (Bandy et al., 1994; Li et al., 1996). All participants were playing full time academy soccer for the same premier league football club for a minimum of 9 months prior to testing. Inclusion criteria were that they were injury free (defined as a ‘time loss injury’ as classified in a consensus statement on injuries within soccer (Fuller et al., 2006)) for the duration of the testing period and that they had previously completed a minimum of three exposures to the testing protocol. All participants were regularly participating in soccer training sessions and lower limb gym strengthening sessions between tests and all were exposed to similar physical stimulus over this period. The study obtained ethical approval from the School of Health Research Ethics Approval Panel at University of Bath and all participants were informed of the potential benefits and risks of the research prior to providing informed consent. For participants under the age of 18 (age range: 16.8-19.5 y), parental informed consent was obtained also.
ProceduresPrior to testing, participants completed a 5-minute standardised warm up at approximately 60-75 Watts on a cycle ergometer (Keiser M3+, Keiser Corporation, California) followed by ten controlled bodyweight squats and three countermovement jumps. The testing procedure, outlined in Table 1 using example resistances, involved completing an incremental leg press test from a seated position (approximately 90° knee flexion) with feet flat on each footplate beginning at low resistance and continuing until failure, with ‘max resistance’ pushed defined as the final load that could be moved to full knee extension with both legs whilst maintaining proper seating position (McDonagh and Davies, 1984). Resistance reached on the 10th repetition and resistance increments in-between each repetition were set dependent on participant’s results from previous exposure tests and remained the same for all three trials. However, as participants were encouraged to work until max resistance was reached, total number of repetitions completed differed between participants. Participants were asked to complete each repetition through extending both legs together with maximum velocity and instruction to ‘push as fast and as evenly as possible’. For each effort, peak force, velocity and power were recorded for each leg. Power output calculated for each repetition is a product of force and velocity registered in the air cylinders of the device as footplates are moved. As the footplates of the device move, air pressure increases within the air cylinders with force measured as the highest air pressure value detected for each repetition. Velocity is measured as the highest rate of displacement of the piston within the cylinder for each repetition. During rest periods between reps, participants were allowed, but not instructed, to remove their feet from the foot plates, but remained seated at all times. Participants knew the resistance that they were attempting next and received an instantaneous average power feedback following each repetition but at no point were encouraged to use this feedback to affect their results. All trials completed in the study were conducted by the same investigator. Regardless of the number of repetitions in each test (Mean±SD: 11.2 ± 0.9), peak power (the highest power output from each test for each leg), average power (the average of all power outputs for each leg) and last 4 repetition average power (the average of the power output from the last 4 repetitions of each test for each leg) variables were recorded for each test. A linear trend line plotted through all force-velocity data points extrapolated to 0N force and to 0m/s calculated velocity max variable and force max variable respectively (Figure 1). Peak power combined, average power combined, last 4 repetition average power combined, force max combined and velocity max combined variables were then calculated by taking the sum of the left and right leg values for each respective variable.
Imbalance calculationsLeft-right power imbalance scores were also calculated for peak, average and last 4 repetition average power in three different ways- absolute differences, percentage differences and symmetry angle. Absolute differences were calculated using the following equation:
Percentage differences were calculated similar to previous research (Impellizzeri et al., 2007) but with adjustment of numerator to account for critique by Bishop et al (2016). Percentage difference was calculated using the following equation:
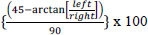
Symmetry angles were calculated similar to previous research (Zifchock et al., 2008) using the following equation:
For all calculations, any positive results denoted right dominance and negative results denote left dominance.
Statistical analysesData were analysed using Microsoft Excel (Microsoft, Redmond, WA) and statistical package SPSS (Version 17.0; Chicago, IL) and all data are presented as mean ± standard deviation. Paired samples t-tests were used to determine if significant differences existed between consecutive tests (Test 1-Test 2 and Test 2-Test 3). Within subject reliability was assessed with the use of a two way mixed model ICC (3,1) and typical error, which was expressed as both a percentage (TPE) and as an absolute value (TE) for raw data values. Only TE was used for imbalance values as taking a percentage error value of a small percentage value produces values that may mislead and therefore were considered inappropriate. The strength of relationships for ICC coefficients was classified as: 0.3 ≤ r < 0.5 was ‘poor’, 0.5 ≤ r < 0.75 was ‘moderate’, 0.75 ≤ r < 0.9 was ‘good’ and 0.9 ≤ r < 1.0 was ‘excellent’ (Koo and Li, 2016). To establish the limits for meaningful change around data, the mean of the outcome variable across all three tests ±1.75 x TE for the outcome variable was used (Hopkins, 2000). The data were considered for heteroscedasticity by plotting difference between consecutive tests results (Test 1-Test 2 and Test 2-Test 3) against averaged results from the respective tests. A moderate trend towards heteroscedasticity was found for last 4 repetition power variables (r2 = 0.002-0.479) and therefore, for TPE calculations for these variables, data was log transformed.
Lower limb strength and powerTo establish reliability, change in strength and power variables (Mean ± SD) across all three tests was calculated. No significant differences were found between Test 1-Test 2 or between Test 2-Test 3 for any variables (p > 0.156) (Table 2). Between Test 1-Test 2, all variables showed TPE values < 7.1% and ICC > 0.806, and between Test 2-Test 3, all variables showed TPE <7.0% and ICC > 0.849. When establishing reliability across all three tests, all variables showed TPE values <6.9% with ICC values > 0.762 (Table 3).
Left-right limb power imbalanceTo establish reliability of lower limb imbalance variables, mean change across all 3 tests was calculated (Table 4). Between Test 1 and Test 2, significant differences were found for % difference last 4 repetitions and symmetry angle last 4 repetitions (p < 0.033) whilst all other imbalance variables were not significantly different (p > 0.055). No significant differences were found for any imbalance variables between Test 2 and Test 3 (p > 0.288). Comparing Test 1-Test 2 and Test 2-Test 3, average power and last 4 repetition power imbalance values established ICC values >0.780 and peak power imbalance variables established ICC values <0.768. Combining all three tests (Table 5) average power and last 4 repetition power imbalance values established ICC values >0.843 with peak power imbalance variables established ICC values <0.647. TE values show % difference variations between 2.07-3.56, symmetry angle variations between 0.69-1.19 and absolute difference variations between 20.0-45.04 (Table 5). Across all calculations, average power imbalance values (% difference average, difference average and symmetry angle average) establishing the narrowest TE values.
Limits of meaningful changeTo establish the smallest significant change between tests, ranges of meaningful change for each variable were calculated from their respective TE values (Table 6). Alongside this, lower and upper limits of non-meaningful change placed around mean values have been calculated as an example. For imbalance calculations, due to large TE values, peak imbalance variables (% difference Peak, difference peak and symmetry angle peak) established the largest range of non-meaningful change whilst average imbalance variables established the narrowest range.
The primary aim of the current study was to determine the reliability of lower limb strength, power and asymmetry obtained through seated leg press in elite soccer players. No significant differences were observed between consecutive tests for all lower limb strength and power variables, with the ICC values >0.866 suggesting ‘good’ reliability. Average imbalance variables (% difference average, difference average and symmetry angle average) also showed no significant differences between tests, moderate TE values and high ICC values > 0.874 suggesting ‘good’ test-retest reliability. Peak imbalance variables were found to have the lowest ICC values (<0.657) and the highest TE values whilst last 4 repetition imbalance variables showed significant differences between Tests 1 and 2, limiting their reliability as applicable imbalance measures. The current study also established ranges of non-meaningful change for all variables, to more accurately evaluate magnitude of change between tests. Peak imbalance variables established the largest range (±6.2%) whilst average imbalance variables established the narrowest range (±3.6%) of non-meaningful change. In the current study, all lower limb strength and power variables showed ‘good’ reliability with no significant differences across any tests and therefore can be used with confidence in future research. In particular, maximum resistance showed ‘good’ reliability with an ICC value of 0.893 and TPE of 5.9%. This corresponds well with the only other published research on the reliability of the Keiser seated leg press, which found ‘excellent’ reliability (ICC: 0.990) of maximum resistance values and non-significant increases of 1.1% between test 1 and test 2 (LeBrasseur et al., 2008). In the current study, all between-tests error values for single leg measurements ranged between 5.3-6.9%, similar to values seen in single leg hop (Risberg et al., 1995) and isokinetic dynamometry (Pincivero et al., 1997) reliability studies. Similarly, ICC results found in the current study for all strength and power variables (ICC: 0.846-0.898) correlate well with single leg hop (Bandy et al. 1994; Paterno and Greenberger, 1996) and isokinetic dynamometry (Gleeson and Mercer, 1992) reliability studies, showing ‘good’ reliability. Average power imbalance variables (% difference average, difference average and symmetry angle average) were not significantly different between any tests, with ICC values >0.874, and the lowest TE values in comparison to all other imbalance variables. Therefore, all average difference variables can be considered the most reliable imbalance measures and most applicable to be used in future research. Results found with average difference variables in the current study are similar to that found in other studies assessing left-right leg imbalance reliability through single leg hops (Hopper et al., 2002, Reid et al., 2007) and isokinetic dynamometry (Impellizzeri et al., 2008). Although different error calculations were used between studies, 2.1% TE seen in the current study is similar to SEM values seen for single leg hop tests of 3.0-5.6% (Reid et al., 2007) and for single leg isokinetic dynamometry of 3.2-8.7% (Impellizzeri et al., 2008). In contrast, peak imbalance variables (difference peak, % difference peak and symmetry angle peak) resulted the lowest ICC values across all tests (ICC < 0.657) and the largest TE across all imbalance variables, showing that peak imbalance variables have the weakest reliability of all imbalance variables. Similarly, % difference last 4 repetitions and symmetry angle last 4 repetitions were shown to have significant differences between 1st and 2nd tests, suggesting low reliability of these imbalance variables also. However, as no significant differences were found between 2nd and 3rd tests for either variables, it may be the case that greater familiarisation to heavier loads is needed to improve the reliability of last 4 repetition imbalance values. Indeed, whilst reliability is yet to be confidently established, the current study shows that larger differences between left and right leg power are seen over the last 4 repetitions in comparison to all other imbalance variables (Table 4), and it may be the case that power near maximal loads highlights a dominance that power at lighter loads does not. Despite differences in calculations between absolute difference, percentage difference and symmetry angle imbalance values, no differences were seen between test-retest results in the current study for any of the imbalance calculations. Therefore, for clarity, any one of the calculation methods in the current study can be used to represent left-right leg power imbalance with selection of the most appropriate calculation based on what is considered most appropriate to the individual practitioner in the applied environment. To accurately evaluate the magnitude of change between tests for future research, the current study also aimed to establish the range of non-meaningful change around each variable to quantify the natural variability of the participants and of the testing equipment. These values were calculated by multiplying the TE across all 3 tests for each variable by 1.75 (Hopkins, 2000). For instance, for an individual with an average power of 2000W, values beyond the range of 1833W-2167W (2000±167W) are likely a meaningful change and are not due to variability in the individual or the testing equipment/protocol. A limitation of the current study may be that the Keiser incremental resistance leg press protocol, which increases resistance in block increments dependent on the pre-determined maximum resistance (see Table 1) and therefore may be unable to identify subtle variations in an individual’s strength and power. For example, a 10-repetition test with max resistance set at 300 kg will increase from 300 kg to 328 kg between repetitions. It is possible that this ~9% increase may be too great and result in failure even though improvements may be apparent between tests. However, in the context of the applied environment, the magnitude of this limitation of the testing protocol is not considered great enough to employ an alternative method with greater sensitivity, which would introduce time efficiency and practicality limitations of its own. Additionally, although movement completed in the testing modality is multiarticular in nature, as movements are completed in a seated position with a fixed trunk direct specificity in relation to soccer could be questioned. The current study established the reliability of single and double leg strength and power output of elite soccer players over varying resistances as well as bilateral left-right leg power imbalances obtained through the Keiser Air 420 incremental resistance leg press protocol. There were no significant differences between 3 test-retest trials for all strength and power variables. Results from imbalance calculations showed that average power imbalance variables (% difference average, difference average and symmetry angle average) offer a reliable form of calculating left-right leg imbalance values with no significant differences across all trials, ‘good’ ICC values, and the lowest TE of all imbalance calculations. However, due to weaker test-retest results, peak power and last 4 repetition imbalances variables cannot be considered as reliable imbalance measures. TE values found in the current study were also used to establish appropriate ranges of meaningful change for all variables to better inform future testing. ConclusionsThe current study has established that maximal strength, single and double leg power output and average bilateral imbalance of soccer players results obtained through a seated leg press protocol can show an acceptable level of reliability and therefore gives practitioners greater confidence in any results obtained through the current testing protocol. Additionally, establishing the limits of meaningful change ranges for all variables allows practitioners to derive a greater detailed, accurate evaluation on the magnitude of changes between repeated tests in soccer players.
| ACKNOWLEDGEMENTS |
This study was funded by a grant from Keiser Corporation. However Keiser Corporation had no role in the study design, the collection, analysis and interpretation of any data or the decision to publish the study. The study complied with the laws of the country of the authors’ affiliation. |
|
| AUTHOR BIOGRAPHY |
|
 |
James Redden |
| Employment: Sports Scientist at Tottenham Hotspur Football Club. |
| Degree: MSc |
| Research interests: Athlete load/fatigue monitoring and injury risk management. |
| E-mail: james.redden@tottenhamhotspur.com |
| |
 |
Keith Stokes |
| Employment: Head of the Department of Health, University of Bath, UK |
| Degree: PhD |
| Research interests: Injury risk in sport and the development of strategies to reduce injury risk. |
| E-mail: k.stokes@bath.ac.uk |
| |
 |
Sean Williams |
| Employment: Lecturer in the Sport, Health and Exercise Science Research Group, University of Bath, UK |
| Degree: PhD |
| Research interests: Statistical modelling techniques to assist identify risk factors for injury. |
| E-mail: s.williams@bath.ac.uk |
| |
|
| |
| REFERENCES |
 Abernethy P., Wilson G., Logan P. (1995) Strength and power assessment. Issues, controversies and challenges. Sports Medicine 19, 401-417. |
Ali A., Williams C. (2013) Isokinetic and isometric muscle function of the knee extensors and flexors during simulated soccer activity: effect of exercise and dehydration. Journal of Sports Sciences 31, 907-916. |
Bandy W.D., Rusche K.R., Tekulve F.Y. (1994) Reliability and limb symmetry for five unilateral functional tests of the lower extremities. Isokinetics and Exercise Science 4, 108-111. |
Bishop C., Read P., Chavda S., Turner A. (2016) Asymmetries of the lower limb: The calculation conundrum in strength training and conditioning. Strength & Conditioning Journal 38, 27-32. |
Bolgla L.A., Keskula D.R. (1997) Reliability of lower extremity functional performance tests. Journal of Orthopaedic and Sports Physical Therapy 26, 138-142. |
Booher L.D., Hench K.M., Worrell T.W., Stikeleather J. (1993) Reliability of Three Single-Leg Hop Tests. Journal of Sport Rehabilitation 2, 165-170. |
Cabri, J., De Proft, E., Defour, W. and Clarys, J.P. (1988) The relation
between muscular strength and kick performance. In: Science
and football. Eds: Reilly, T., Lees, A., Davids, K. and Murphy,
W.J. London: E. and F.N. Spon. 186-193. |
Cometti G., Maffiuletti N.A., Pousson M., Chatard J.C., Maffulli N. (2001) Isokinetic strength and anaerobic power of elite, subelite and amateur French soccer players. International Journal of Sports Medicine 22, 45-51. |
Croisier J.L., Forthomme B., Namurois M.H., Vanderthommen M., Crielaard J.M. (2002) Hamstring muscle strain recurrence and strength performance disorders. American Journal of Sports Medicine 30, 199-203. |
Fousekis K., Tsepis E., Vagenas G. (2010) Lower limb strength in professional soccer players: profile, asymmetry, and training age. Journal of Sports Science and Medicine 9, 364-373. |
Fuller C.W., Ekstrand J., Junge A., Andersen T.E., Bahr R., Dvorak J., Hägglund M., McCrory P., Meeuwisse W.H. (2006) Consensus statement on injury definitions and data collection procedures in studies of football (soccer) injuries. British Journal of Sports Medicine 40, 193-201. |
Gleeson N.P., Mercer T.H. (1992) Reproducibility of isokinetic leg strength and endurance characteristics of adult men and women. European Journal of Applield Physiology and Occupational Physiology 65, 221-228. |
Henderson G., Barnes C.A., Portas M.D. (2010) Factors associated with increased propensity for hamstring injury in English Premier League soccer players. Journal of Science and Medicine in Sport 13, 397-402. |
Hopkins W.G. (2000) Measures of reliability in sports medicine and science. Sports Medicine 30, 1-15. |
Hopper D., Goh S., Wentworth L., Chan D., Chau J., Wootton G., Strauss G., Boyle J. (2002) Test–retest reliability of knee rating scales and functional hop tests one year following anterior cruciate ligament reconstruction. Physical Therapy in Sport 3, 10-18. |
Hsu A.L., Tang P.F., Jan M.H. (2002) Test-retest reliability of isokinetic muscle strength of the lower extremities in patients with stroke. Archives of Physical Medicine and Rehabilitation 83, 1130-1137. |
Impellizzeri F.M., Bizzini M., Rampinini E., Cereda F., Maffiuletti N.A (2008) Reliability of isokinetic strength imbalance ratios measured using the Cybex NORM dynamometer. Clinical Physiology and Functional Imaging 28, 113-119. |
Impellizzeri F.M., Rampinini E., Maffiuletti N., Marcora S.M. (2007) A vertical jump force test for assessing bilateral strength asymmetry in athletes. Medicine & Science in Sports & Exercise 39, 2044-2050. |
Jones P.A., Bampouras T.M. (2010) A comparison of isokinetic and functional methods of assessing bilateral strength imbalance. Journal of Strength & Conditioning Research 24, 1553-1558. |
Knapik J.J., Bauman C.L., Jones B.H., Harris J.M., Vaughan L. (1991) Preseason strength and flexibility imbalances associated with athletic injuries in female collegiate athletes. American Journal of Sports Medicine 19, 76-81. |
Koo T.K., Li M.Y. (2016) A guideline of selecting and reporting intraclass correlation coefficients for reliability research. Journal of Chiropractic Medicine 15, 155-163. |
LeBrasseur N.K., Bhasin S., Miciek R., Storer T.W. (2008) Tests of muscle strength and physical function: reliability and discrimination of performance in younger and older men and older men with mobility limitations. Journal of the American Geriatrics Society 56, 2118-2123. |
Li R.C., Wu Y., Maffulli N., Chan K.M., Chan J.L. (1996) Eccentric and concentric isokinetic knee flexion and extension: a reliability study using the Cybex 6000 dynamometer. British Journal of Sports Medicine 30, 156-160. |
McDonagh M.J., Davies C.T. (1984) Adaptive response of mammalian skeletal muscle to exercise with high loads. European Journal of Applied Physiology and Occupational Physiology 52, 139-155. |
Mognoni P., Narici M.V., Sirtori M.D., Lorenzelli F. (1994) Isokinetic torques and kicking maximal ball velocity in young soccer players. Journal of Sports Medicine and Physical Fitness 34, 357-361. |
Munro A.G., Herrington L.C. (2011) Between-session reliability of four hop tests and the agility T-test. Journal of Strength & Conditioning Research 25, 1470-1477. |
Nevill A.M., Atkinson G. (1997) Assessing agreement between measurements recorded on a ratio scale in sports medicine and sports science. British Journal of Sports Medicine 31, 314-318. |
Newton R.U., Gerber A., Nimphius S., Shim J.K., Doan B.K., Robertson M., Pearson D.R., Craig B.W., Häkkinen K., Kraemer W.J. (2006) Determination of functional strength imbalance of the lower extremities. Journal of Strength & Conditioning Research 20, 971-977. |
Nuzzo J.L., Anning J.H., Scharfenberg J.M. (2011) The reliability of three devices used for measuring vertical jump height. Journal of Strength & Conditioning Research 25, 2580-2590. |
Oliver J., Armstrong N., Williams C. (2008) Changes in jump performance and muscle activity following soccer-specific exercise. Journal of Sports Science 26, 141-148. |
Orchard J., Marsden J., Lord S., Garlick D. (1997) Preseason hamstring muscle weakness associated with hamstring muscle injury in Australian footballers. American Journal of Sports Medicine 25, 81-85. |
Ortega F.B., Artero E.G., Ruiz J.R., Vicente-Rodriguez G., Bergman P., Hagströmer M., Ottevaere C., Nagy E., Konsta O., Rey-López J.P. (2008) Reliability of health-related physical fitness tests in European adolescents. The HELENA Study. International Journal of Obesity 32, 49-57. |
Paterno M., Greenberger H. (1996) The test-retest reliability of a one legged hop for distance in young adults with and without ACL reconstruction. Isokinetics and Exercise Science 6, 1-6. |
Pincivero D.M., Lephart S.M., Karunakara R.A. (1997) Reliability and precision of isokinetic strength and muscular endurance for the quadriceps and hamstrings. International Journal of Sports Medicine 18, 113-117. |
Reid A., Birmingham T.B., Stratford P.W., Alcock G.K., Giffin J.R. (2007) Hop testing provides a reliable and valid outcome measure during rehabilitation after anterior cruciate ligament reconstruction. Physical Therapy 87, 337-349. |
Reilly, T. (1996) Motion analysis and physiological demands. In: Science
and Soccer. Ed: Reilly, T. London: E. and F.N. Spon. 65-81. |
Risberg M.A., Holm I., Ekeland A. (1995) Reliability of functional knee tests in normal athletes. Scandinavian Journal of Medicine & Science in Sports 5, 24-28. |
van Beijsterveldt A.M., van de Port I.G., Vereijken A.J., Backx F.J. (2013) Risk factors for hamstring injuries in male soccer players: a systematic review of prospective studies. Scandinavian Journal of Medicine & Science in Sports 23, 253-262. |
Wiklander J., Lysholm J. (1987) Simple tests for surveying muscle strength and muscle stiffness in sportsmen. International Journal of Sports Medicine 8, 50-54. |
Young W., MacDonald C., Heggen T., Fitzpatrick J. (1997) An evaluation of the specificity, validity and reliability of jumping tests. Journal of Sports Medicine and Physical Fitness 37, 240-245. |
Zifchock R.A., Davis I., Higginson J., Royer T. (2008) The symmetry angle: a novel, robust method of quantifying asymmetry. Gait Posture 27, 622-627. |
|
| |
|
|
|
|